Metrics
In this tutorial we will cover the metrics page. After this tutorial you will know how to view metrics specific to your pet.
Prerequisites
To access this page, it is required that you have a pet with which to view metrics. It is also advised that you add data to your pet to get the most out of this page.
Overview
The metrics page is used to view all of your pet's metrics in one single location.
Upon navigating to the pet metrics page you will have the ability to select a given metric of interest and add any associated graphs.
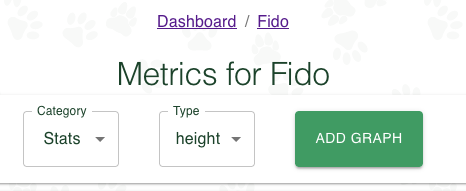
| Field | Description |
|---|---|
| Category | The Metric Category. Options available are Stats and `Notes. |
| Type | The metric type. For Stats the options are dependent on the stats available for the pet. Notes are based on the existing graph options in the notes section. |
To add a graph, you can simply select the category, the type, and then press the "Add Graph" button.
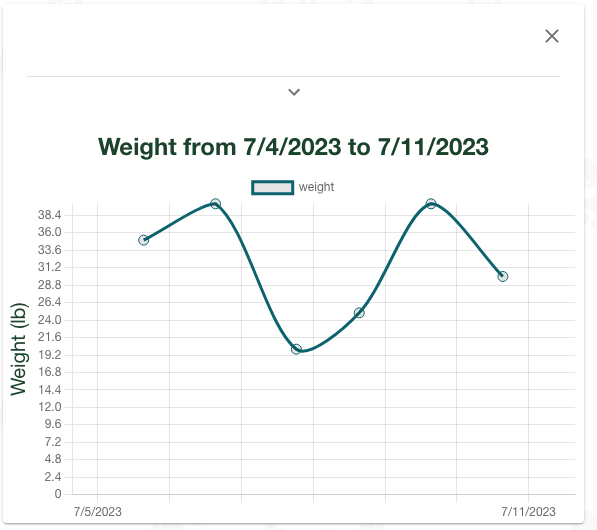
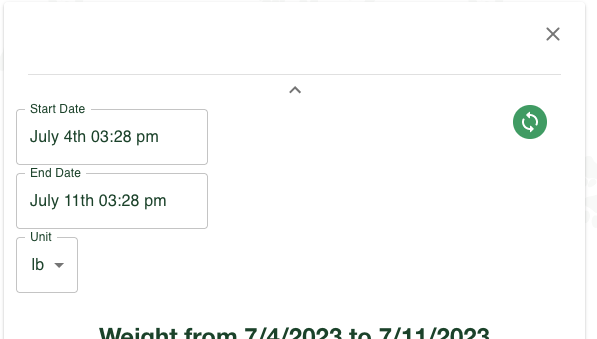
In the advanced menu you have options to adjust the graph by either changing the unit, (free users), or changing the date range, (premium users). You can add as many graphs for as many possible stats or for as many ranges as you want.
What's next?
Next, we'll look at the settings page.